REPORT
14.11.24

Report on the results of the survey on user satisfaction with statistical information provided by the Agency of Statistics under the President of the Republic of Tajikistan and its territorial bodies (hereinafter referred to as the Agency).
1. Main Provisions
Survey Object: users of statistical information.
Survey Subject: satisfaction of users with statistical information provided by the Agency.
Survey Objective: to assess the level of user satisfaction with statistical information provided by the Agency.
Survey Tasks:
- Assess the level of demand for statistical information;
- Evaluate the satisfaction level of users with the quality of official statistical information provided by the Agency;
- Assess the satisfaction level of users with the performance of the official website of the Agency (http://www.stat.tj);
- Evaluate the overall satisfaction level of users with the activities of the Agency.
Within the framework of the project “Modernization of the National Statistical System in Tajikistan” for the period of 2022-2026, Russell Bedford AAA conducted a survey on the satisfaction of users with statistical information, and comprehensive responses were received on a wide range of issues. Data collection was conducted from August 21, 2024, to September 30, 2024, using a web-based self-completion questionnaire.
The questionnaire consisted of three sections: “Use of Statistical Information” (11 questions), “Activities of the Agency in Providing Official Statistical Information” (10 questions), and “Characteristics of Data Users” (socio-demographic block) (4 questions), totaling 25 questions.
2. Survey Results
The results of the satisfaction survey concerning the statistical information provided by the Agency and the overall performance of the Agency are based on the materials of a sociological survey of 245 experts, specialists in economics and statistics, representatives of government bodies, scientific and educational institutions, NGOs, the business community, and the media.
The survey was conducted from August 21, 2024, to september 30, 2024. The objective of the survey was to assess the level of satisfaction of users with the statistical information provided by the Agency.
The socio-demographic section of the survey showed that 67.51% of respondents were men and 32.49% were women. Most respondents were aged 36-50 years (55.96%) and the majority of respondents had higher professional education (95.31%).


Of all those who answered the question about their field of activity, 55.23% represented private enterprises, 13.72% central government bodies, 11.19% a non-governmental organization, 6.14% local authorities, 3.61% teachers or students, 1.81% international organizations, 1.44% media, 0.36% private users, 3.25% researchers, and 3.25% other sectors.

3. Demand for Statistical Information
The survey results showed that statistical information remains highly sought after and is used regularly. 5.78% of respondents refer to statistical information every week, 35.38% 2-3 times a month, 23.10% every quarter, 9.39% several times a quarter, and 8.30% once every six months.

The purposes for using statistical information by our respondents vary. Most experts refer to statistical information for preparing reports, presentations, and forecasts to fulfill job duties – 40.82%, as well as for data analytics – 40.82%, professional activity/business/marketing research – 32.65%, research purposes – 20.41%, and for educational purposes – 8.98%. It should also be noted that 31.84% use it for policy development and making management decisions, and 12.65% for preparing reports or publications.

The greatest interest among users is in statistical data related to the labor market and employment – 55.51%, in the field of trade and services – 42.45%, finance – 38.78%, demography – 20.82%, industry – 19.18%, national accounts – 18.37%, tourism – 16.73%, and transport and communications – 16.33%.

Primarily, respondents use sources such as official press releases/websites of the Statistical Agency – 57.55%, publications of the Statistical Agency (paper versions – compendiums, bulletins) – 41.22%, mass media – 38.78%, as well as inquiries to the Agency/its regional offices (in written form on paper, in electronic document format, by phone, personal reception) – 26.94%.

The majority of respondents obtained materials/data in electronic form (downloaded for free from the website, received via distribution, etc.) – 67.51%, from the Statistical Agency in mixed form (both electronic and paper) – 24.55%, and in paper form (through official requests, distribution materials at conferences, etc.) – 7.94%.

4. Accessibility of Statistical Information
In response to the question of how accessible statistical information is across various sectors, the most difficult to access information was noted to be judicial statistics and crime statistics – 25.00% of respondents, and the most easily accessible information was noted to be environmental protection statistics – 81.82% of respondents.

5. Satisfaction with Statistical Information
During the survey, it was important to assess how satisfied users are with the quality of official statistical information. Respondents were asked to rate the official statistical information across different sectors.
With the highest possible score being 5 points, regional statistics received the highest rating – 4.2 points; the lowest rating was given to “Crime and Judicial Statistics” – 3.8 points.

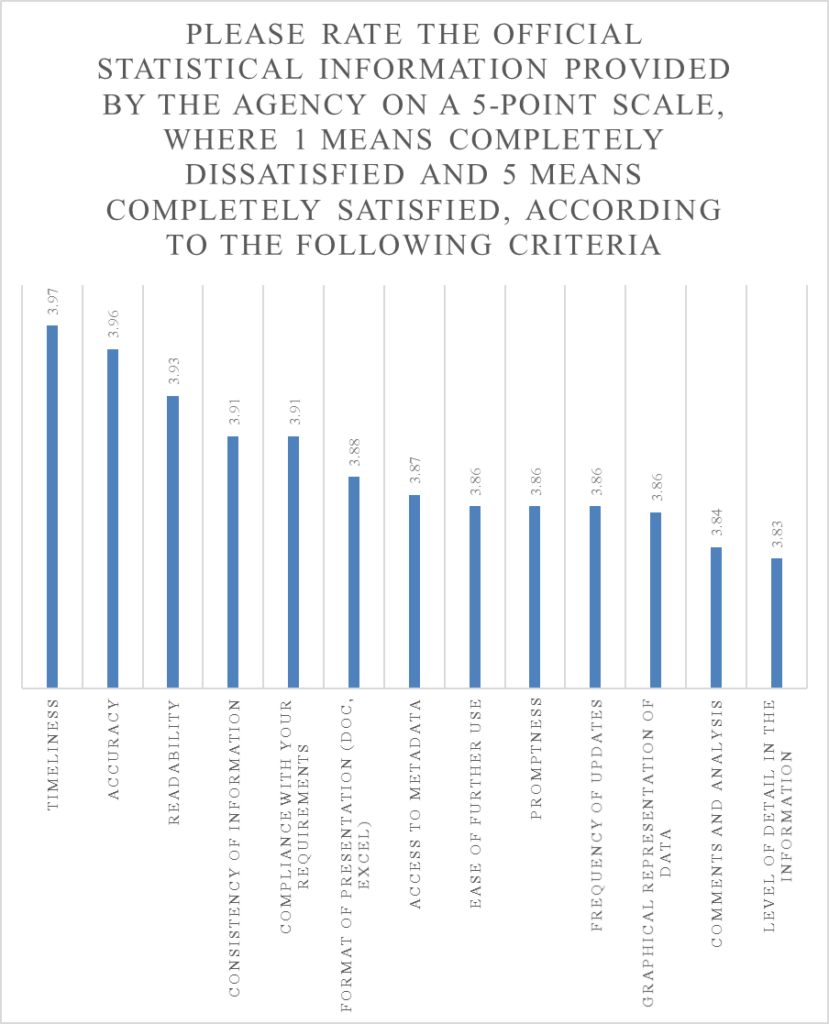
Respondents were also asked to rate official statistical information based on the following quality criteria: level of detail, presentation format (doc, excel), timeliness, accuracy, relevance, compliance with requirements, frequency of provision, consistency of information, access to metadata, ease of reading, commentary and analysis, graphical representation of data, and ease of further use.
The highest score was given to the criterion “relevance” – 3.97 points; the lowest was for “level of detail” – 3.83 points.

Respondents
were asked how comprehensible the methodological explanations accompanying
statistical data were to them. Most respondents indicated that they were
completely understandable – 63.90% (previously 25.58%), somewhat understandable
35.02% (previously 73.95%), and somewhat or completely unclear – 1.08%.

Respondents were asked to evaluate the available volume of statistical information across the various sectors published by the Agency.
A high level of adequacy was noted in the statistics of national accounts, agriculture, environmental protection, tourism, transport, and communications – 100%, and a lack of data in business statistics – 27.27%, crime and judicial system – 25.00%.

In response to the question of how much they trust the data from official statistics in various sectors, respondents distributed their answers as follows: “completely trust” 95.45% – data on environmental protection statistics, followed by data on agriculture (93.90%), “somewhat trust” 54.55% – business statistics data, “somewhat distrust” 8.33% – production (provision).
Among all responses, 82.69% “completely trust” the statistical data, 16.54% “somewhat trust”, 0.77% “somewhat distrust”, and 0.00% “do not trust”. In the previous survey, respondents overall rated as follows: 71.51% indicated they completely trust the statistical data, 26.33% somewhat trust, 1.96% somewhat distrust, and 0.20% do not trust.

Primarily, respondents preferred to use statistical tables – 75.92%, statistical compendiums – 47.76%, and analytical reviews – 36.73%.

According to respondents, the main reasons that compromise the quality of statistical data are the lack of indicators – 58.53%, the reliability of indicators – 20.46%, the period of presentation – 13.53%, methodological explanations – 5.17%, and the format of presentation of indicators – 2.31%. The breakdown by sectors looks as follows:

6. Satisfaction with the Agency’s Overall Performance and the Official Website
During the survey, it was important to assess how satisfied users were with the quality of the Agency’s official website. Of the total number of respondents, 67.51% had visited the official website of the Agency.
Respondents were asked to evaluate the Agency’s website based on the following criteria. With the highest possible score being 5 points, the highest score was for “ease of finding information” at 3.97 points, “your overall impression” at 3.93 points, “convenience” at 3.89 points, “completeness of information provided” at 3.83 points, “timeliness of information updates” at 3.82 points; the lowest score was for “interface” at 3.77 points.
Overall, the performance of the official web portal of the Agency was rated at 3.9 points, which is 0.3 points lower compared to the previous rating of 4.2 points.

Respondents were also asked to evaluate the Agency’s performance over the past year 2023. 81.59% rated it as “positive,” 4.69% said “nothing has changed,” and 10.83% rated it as “above expectations”.

With the maximum index value being 5, the satisfaction index was 3.91 points, which is 0.13 points lower than the previous assessment.
The satisfaction index was calculated using a formula where one indicator measures satisfaction with the official statistical information and another measures satisfaction with the statistical information provided by the Agency based on criteria.

At the end of the user survey, participants were given the opportunity to provide brief recommendations regarding the activities of the Statistics Agency. The main recommendations were as follows:
– Regular updates of the website;
– Timely data presentation;
– Conducting new surveys;
– Transition to full electronic reporting.


0 комментария к “REPORT”